
[ad_1]
On-chain data shows the Bitcoin exchange whale ratio has spiked up recently, a signal that shows dumping may be going on in the market.
Bitcoin Exchange Whale Ratio Surges Up As Price Declines
As pointed out by an analyst in a CryptoQuant post, the BTC exchange whale ratio has risen to very high values recently.
The “exchange whale ratio” is an indicator that measures the ratio between the sum of the top 10 transactions to exchanges and the total amount of Bitcoin moving into exchanges.
In simpler terms, this metric tells us what part of the total exchange inflows the ten largest transactions make up for.
Usually, these large transactions belong to the whales. So if the value of the indicator becomes high, we can tell that whales are sending large amounts to exchanges as they now make up for a bigger part of the total inflows.
Such a trend can prove to be bearish for the price of Bitcoin as it may show that whale dumping is going on currently.
On the other hand, if the ratio goes down, it means a healthier balance is returning the market as whales control a lesser part of the exchange transactions.
Related Reading | JPMorgan Puts Bitcoin At $150,000 In The Long-Term, But What About Its ‘Fair Value’?
Now, here is a chart that shows the trend in the Bitcoin exchange whale ratio over the past year:
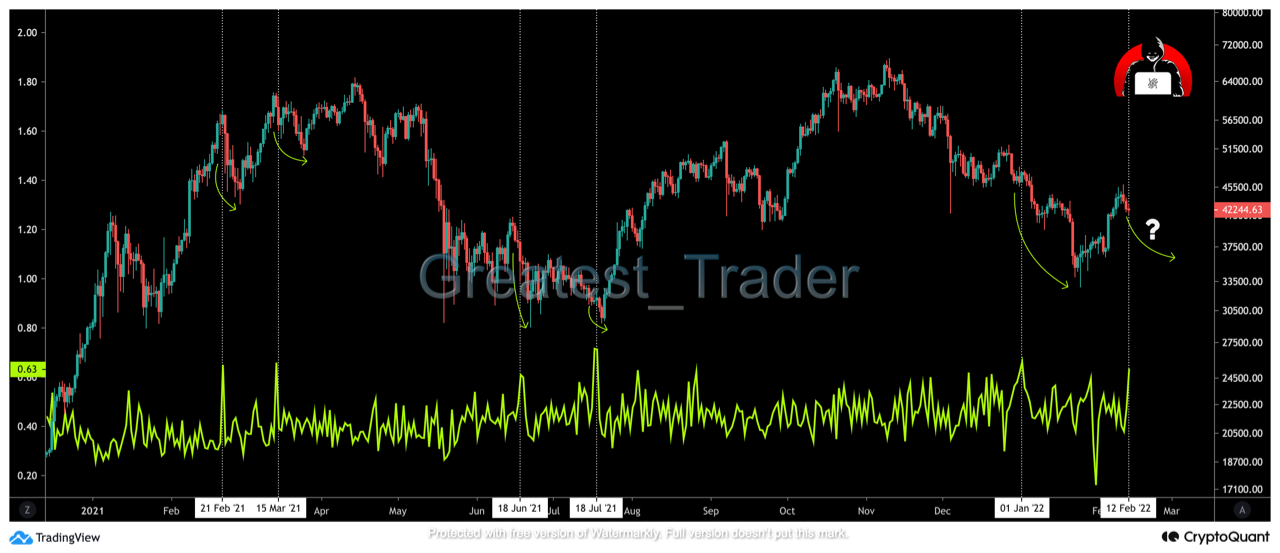
Looks like the value of the indicator has spiked up recently | Source: CryptoQuant
As you can see in the above graph, the Bitcoin whale ratio has surged up to some high values over the past couple of days.
The current values are at similar levels to those observed in early January, shortly following which the price crashed down hard. The quant has marked this trend in the chart.
Related Reading | Bitcoin Active Addresses Surpass 1.02M Three Days In A Row, What Happened Last Time
Since the exchange whale ratio is at these values, a similar trend may follow now as well. In such a scenario, the outlook of the price of Bitcoin will be bearish at least in the short term.
BTC Price
At the time of writing, Bitcoin’s price floats around $42.2k, down 1% in the last seven days. Over the past month, the crypto has lost 1% in value.
The below chart shows the trend in the price of BTC over the last five days.

BTC's price seems to have sunk down over the last few days | Source: BTCUSD on TradingView
A few days ago, Bitcoin’s price had climbed up beyond the $45k mark, but the recovery didn’t last too long. Over the last few days, the coin has dropped down to the current $42k levels.
Featured image from Unsplash.com, charts from TradingView.com, CryptoQuant.com
[ad_2]
Source link