
[ad_1]
The MVRV indicator shows that Bitcoin currently hasn’t reached the top yet, and the crypto may still have room to grow.
Bitcoin MVRV Ratio May Show The Top Hasn’t Been Reached Yet
As pointed out by a CryptoQuant post, on-chain data suggests MVRV ratio values are still low right now, implying that the coin hasn’t yet made the top.
The Market Value to Realized Value (or MVRV in short) ratio is a Bitcoin indicator that’s defined as the market cap divided by the realized cap.
MVRV Ratio = Market Cap ÷ Realized Cap
The metric’s value tells us whether BTC’s current price is fair or not. If the ratio gets too high, it may mean that the coin is overvalued right now. This may imply there is selling pressure at this point.
On the other hand, the price of the coin may be considered undervalued during periods where the MVRV ratio is low. A buying pressure could be present while such values sustain.
Now, here is a chart that shows the trend in the value of this Bitcoin indicator over the past few years:
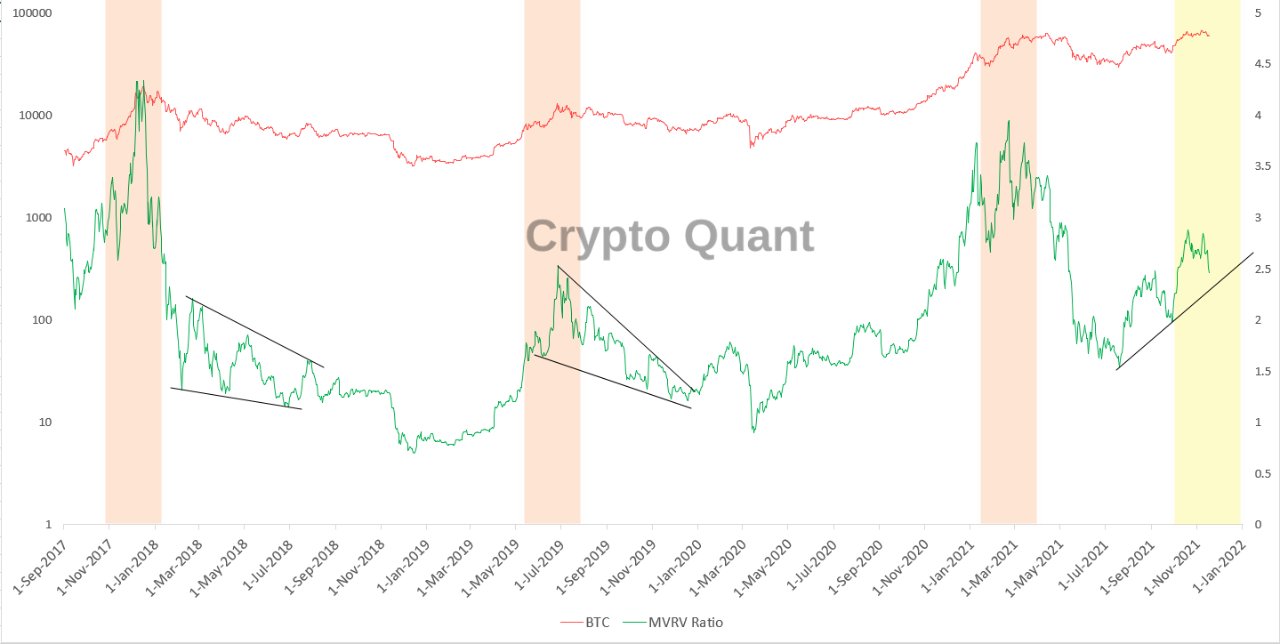
Looks like MVRV values are still not very high | Source: CryptoQuant
As the above graph shows, during all the previous bull runs, the indicator’s value has shown sharp spikes near the top.
Related Reading | Inflation fears sparks Bitcoin rally before Taproot – Crypto Roundup, Nov 15, 2021
As very high values suggest Bitcoin is overvalued and that a correction could come soon, the MVRV ratio may be used to spot tops. Similarly, low values may be considered good buying opportunities.
Looking at the chart, the indicator’s value now seems be lower than what was seen during the early 2021 rally (and also during the 2017 bull run). So this may imply that despite BTC declining in the past few days, the top may not be in yet. And the crypto could still have more room to grow.
BTC Price
At the time of writing, Bitcoin’s price floats around $59k, up 9% in the last seven days. Over the past thirty days, the coin has gained 5% in value.
The below chart shows the trend in the price of BTC over the last five days.

BTC's price has dropped off in the last few days | Source: BTCUSD on TradingView
Since Bitcoin made its new all-time high around $69k, the coin has been trending downwards. In the past few days, the crypto has mostly shown sideways movement.
Related Reading | Preview Of The Peak: November Rains Red For Bitcoin Holders
There hasn’t been any sign of recovery yet, but if the MVRV ratio is anything to go by, BTC’s price may still have a while to go during this run.
Featured image from Unsplash.com, charts from TradingView.com, CryptoQuant.com
[ad_2]
Source link