
[ad_1]
Data from Glassnode reveals Bitcoin holders realized 14 times more losses than profits in recent weeks.
Bitcoin 7-Day MA Realized Profit/Loss Ratio Sets New All-Time Low
As per the latest weekly report from Glassnode, the realized profit/loss ratio has assumed its lowest value ever recently.
Whenever a coin sits idle on the chain and the price of Bitcoin changes, it accumulates some amount of profit or loss, depending upon the direction of the price fluctuation.
This profit or loss is called “unrealized” so as long as the coin holds still in the same wallet, but as soon as the holder moves/sells this coin, the total amount of profit/loss it was carrying is then said to be “realized.”
The realized profit and the realized loss metrics keep track of such amounts of profit and loss being harvested by investors across the BTC market.
Now, the “realized profit/loss ratio” is an indicator that measures the ratio between the current values of these two metrics.
Here is a chart that shows the trend in the 7-day moving average of this Bitcoin ratio over the history of the crypto:
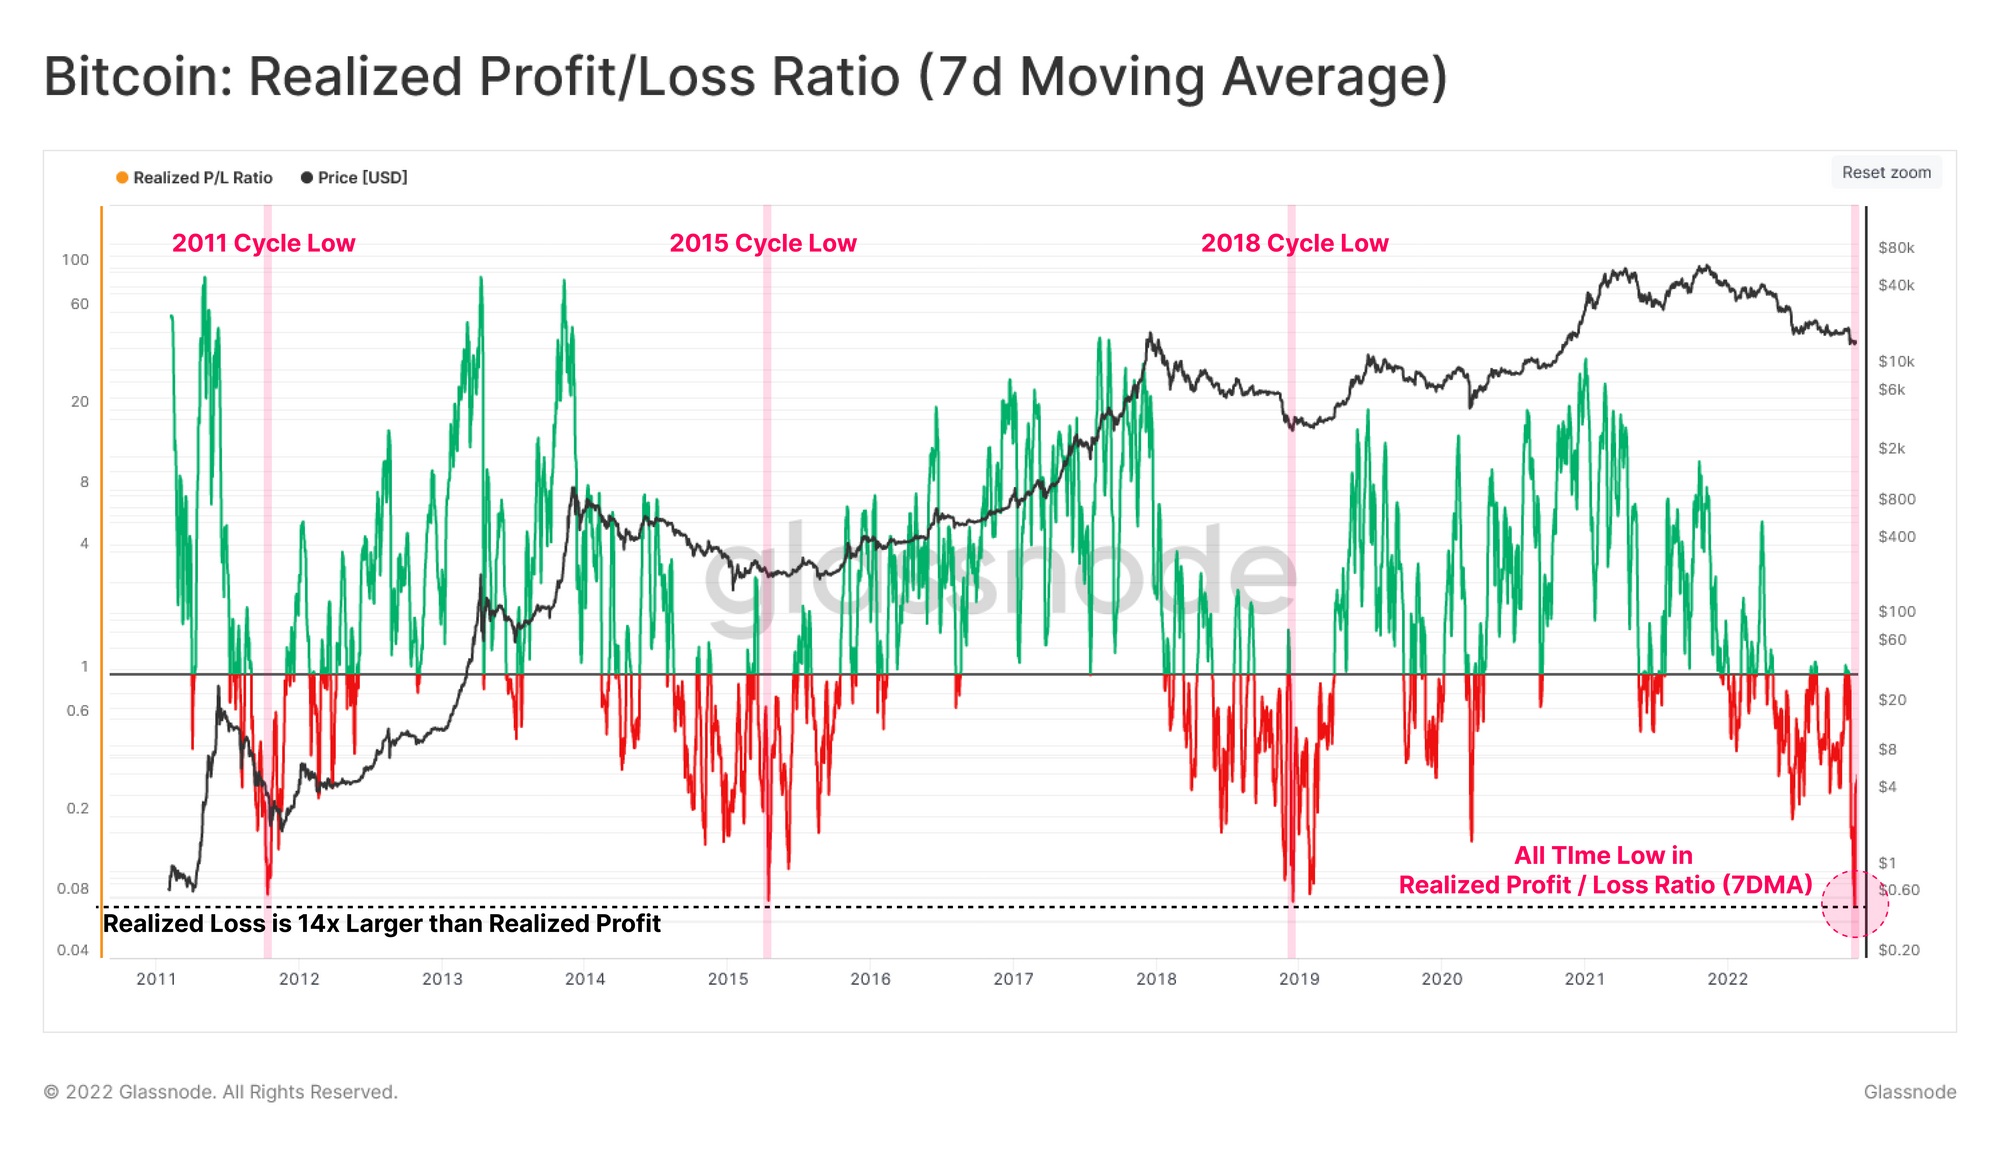
The 7-day MA value of the metric seems to have been quite low in recent days | Source: Glassnode's The Week Onchain - Week 49, 2022
As you can see in the above graph, the Bitcoin realized profit/loss ratio has plunged deep below a value of 1 following the FTX crash.
When the indicator has values in this zone (that is, when it’s less than 1), it means BTC investors are realizing a higher amount of loss than profit right now.
In the latest plunge, the metric not only dropped to pretty low values, it in fact recorded a new all-time low. This bottom level corresponded to the loss realization being 14 times more than profit realization.
From the chart, it’s apparent that deep lows like now have historically been observed at or near bottoms in previous bear markets, which means they have always been at the center of macro market regime shifts.
If the same trend follows this time as well, then the current Bitcoin market may also be in the middle of such a shift.
BTC Price
At the time of writing, Bitcoin’s price floats around $16.9k, up 3% in the last week. Over the past month, the crypto has lost 20% in value.
The below chart shows the trend in the price of the coin over the last five days.

Looks like the value of the crypto has been trading sideways around $17k | Source: BTCUSD on TradingView
Featured image from 愚木混株 cdd20 on Unsplash.com, charts from TradingView.com, Glassnode.com
[ad_2]
Source link