
[ad_1]
The on-chain indicator SOPR suggests that Bitcoin holders have continued to sell at a loss for a while now. This behavior is similar to what was seen during the May-June 2021 mini-bear period.
Bitcoin Investors Have Continued To Dump At A Loss For A Month Now
As pointed out by an analyst in a CryptoQuant post, the BTC SOPR shows that holders are currently selling at a loss.
The “Spent Output Profit Ratio” (or SOPR in short) is an indicator that tells us whether coins moved on a given day were sold at a profit or a loss.
The metric measures so by looking at each coin on the chain and checking what the price the coin was last moved at. After that, the indicator calculates the ratio between this price and the current price.
When the value of the indicator is above one, it means that holders are currently selling, on an average, at a profit.
On the other hand, when the SOPR has values less than one, it implies investors are moving their Bitcoin at a loss overall.
Finally, there is the case when the value of the indicator is exactly equal to one. During such a period, the market is breaking even on BTC sales.
Related Reading | Is The Bitcoin Hashrate Recovering From Kazakhstan’s Crisis? Fear Abides
Now, here is a chart that shows the trend in the value of the Bitcoin SOPR over the past year:
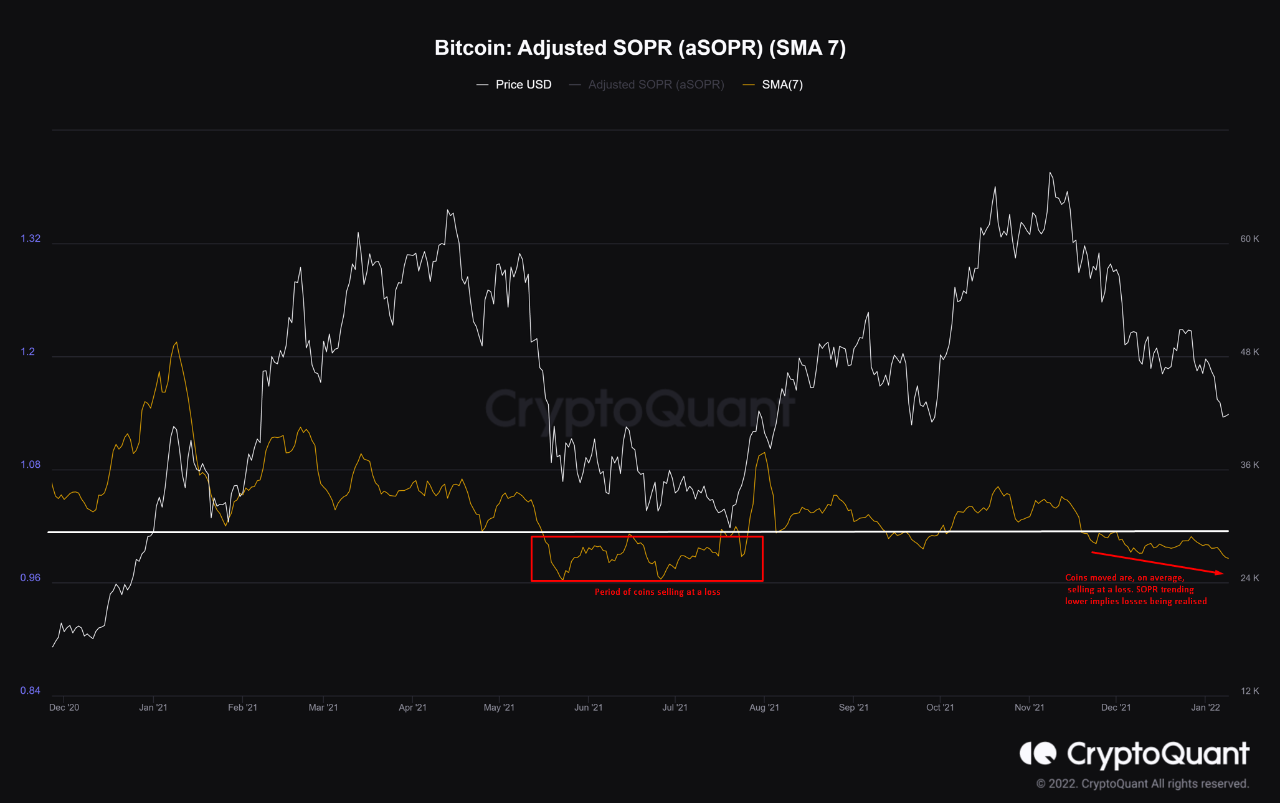
Looks like the value of the indicator has stayed below one recently | Source: CryptoQuant
As you can see in the above graph, the Bitcoin SOPR currently has a value less than one, which means holders are selling at a loss.
Related Reading | Bitcoin Open Interest Continues To Rise, Short Squeeze Incoming?
Such a trend has been there for a month now. A similar situation was there after the May 2021 crash where the indicator stayed below one for a prolonged period of time.
It’s possible that the current trend of low SOPR values will continue for a while, just like back then. The period around May-June was marked by a mini-bear market, and so if the trend does repeat, a similar bear environment could follow in the near future.
BTC Price
Yesterday, Bitcoin’s price briefly declined below the $40k mark, but since then has jumped back up. At the time of writing, the price of the coin floats around $41.7k, down 10% in the last seven days. Over the past month, the crypto has lost 13% in value.
The below chart shows the trend in the price of BTC over the last five days.

BTC's price has continued to move sideways above $40k in the last few days | Source: BTCUSD on TradingView
Featured image from Unsplash.com, charts from TradingView.com, CryptoQuant.com
[ad_2]
Source link