
Bitcoin price failed again to clear the $35,000 resistance against the US Dollar. BTC started a fresh decline below $34,000 and it remains at a risk of more downsides.
- Bitcoin started a fresh decline after it failed to settle above the $35,000 resistance zone.
- The price is now trading below the $33,500 support and the 100 hourly simple moving average.
- There was a break below a major bullish trend line with support near $33,850 on the hourly chart of the BTC/USD pair (data feed from Kraken).
- The pair could correct higher, but the bulls are likely to face resistance near $34,000.
Bitcoin Price Breaks Key Support
Bitcoin gained pace after it broke the $34,000 resistance zone. BTC even spiked above the $35,000 resistance, but there was no upside continuation.
The price formed a high near $35,000 and it started a fresh decline. There was a break below the $34,000 support level. Besides, there was a break below a major bullish trend line with support near $33,850 on the hourly chart of the BTC/USD pair.
The pair is now trading below the $33,500 support and the 100 hourly simple moving average. A low is formed near $33,134 and the price is now consolidating losses.
An initial resistance on the upside is near the $33,550 level. It is near the 23.6% Fib retracement level of the recent decline from the $35,000 swing high to $33,134 low. On the downside, an initial support is near the recent low at $33,134.
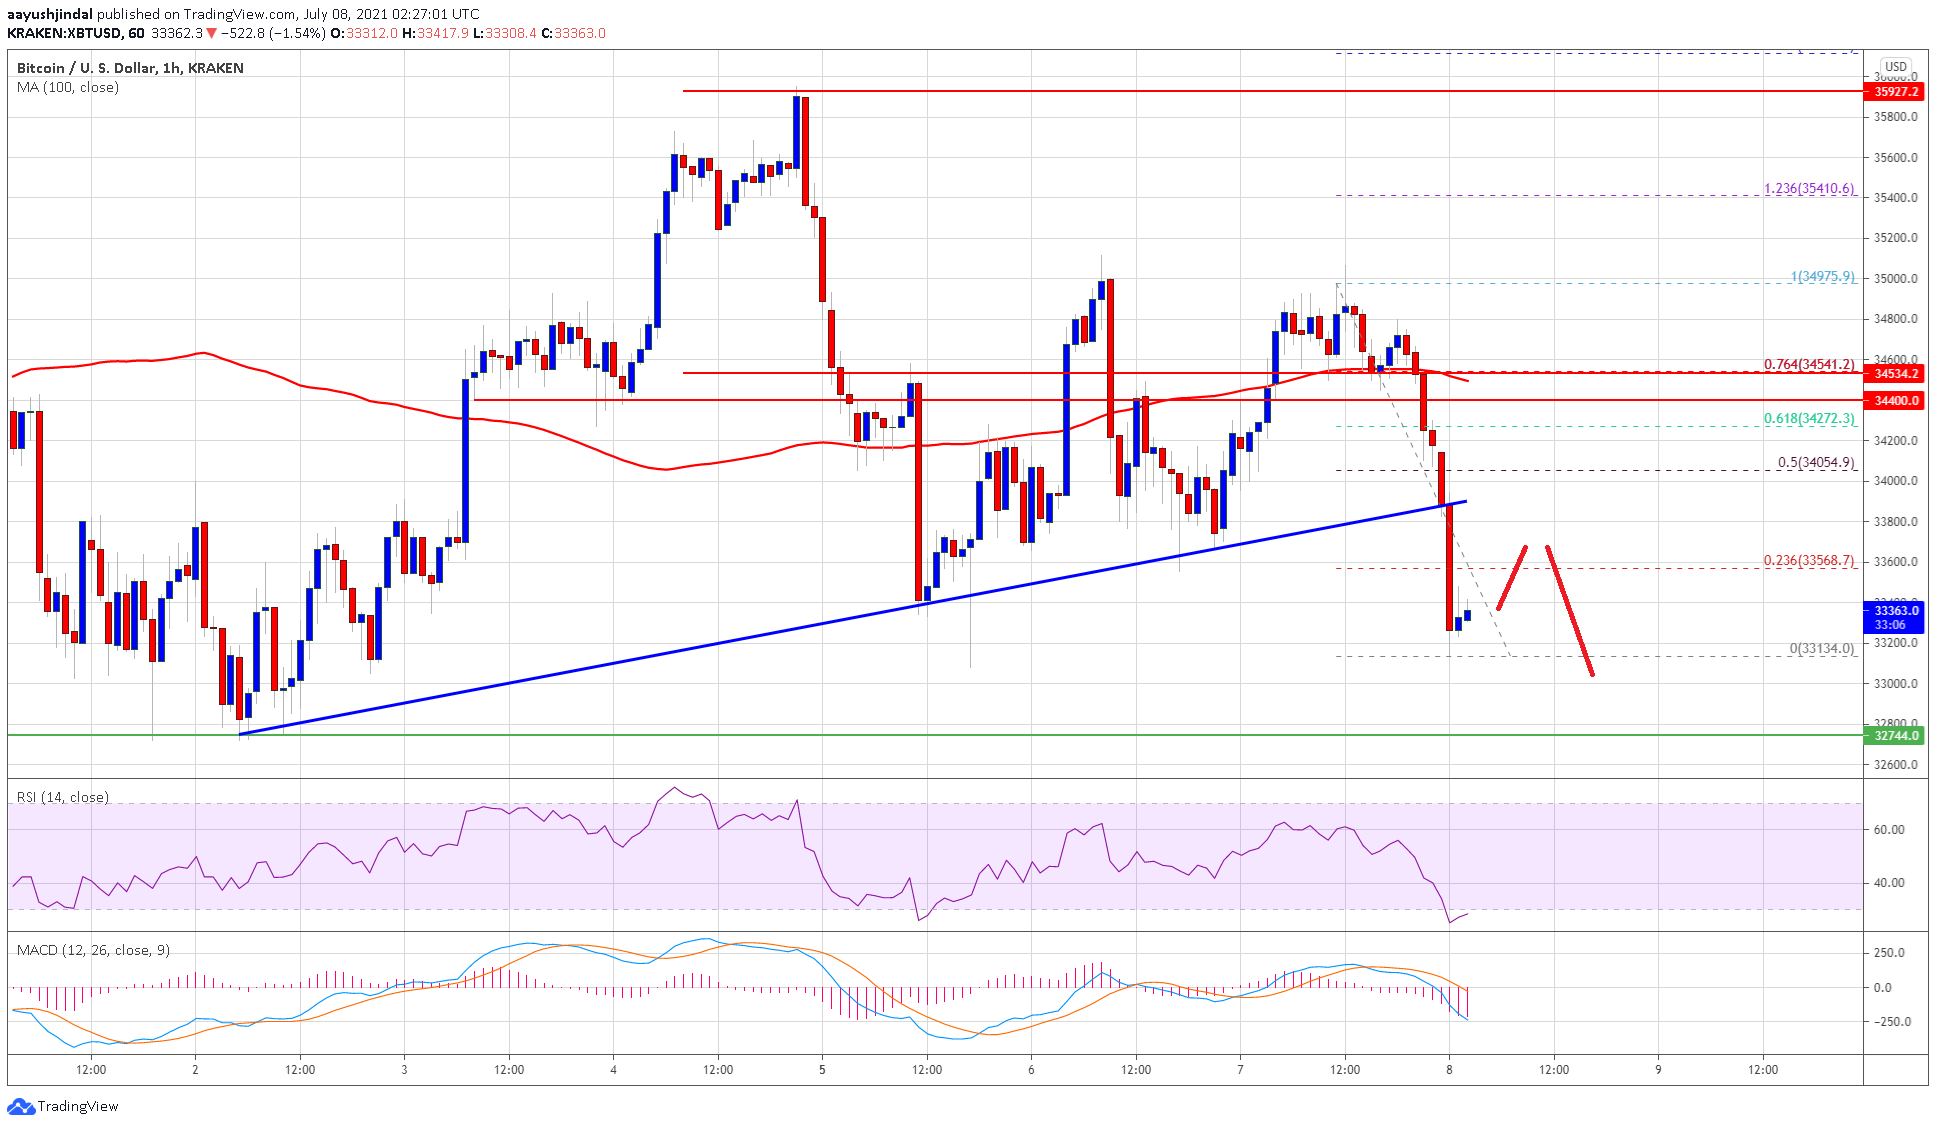
Source: BTCUSD on TradingView.com
The first major support is near the $33,000 zone. If bitcoin price fails to stay above the $33,000 support, there could be a sharp decline. The next major support is near the $32,200 level. If there is a downside break below the $32,200 and $32,000 support levels, the price could continue to move down.
Fresh Increase in BTC?
If bitcoin remains stable above the $33,000 support zone, it could start a fresh increase in the near term. An immediate resistance on the upside is near the $33,550 level.
The first major resistance is near $34,000. It is near the 50% Fib retracement level of the recent decline from the $35,000 swing high to $33,134 low. If there is a close above the $34,000 resistance zone, the price could rise towards the $35,000 hurdle.
Technical indicators:
Hourly MACD – The MACD is now gaining pace in the bearish zone.
Hourly RSI (Relative Strength Index) – The RSI for BTC/USD is now in the oversold zone.
Major Support Levels – $33,000, followed by $32,200.
Major Resistance Levels – $33,550, $34,000 and $35,000.


