
[ad_1]
On-chain data shows Bitcoin long-term holders are dumping their coins as BTC plummets below the $17,000 level.
Bitcoin Long-Term Holder SOPR Spikes Today
As pointed out by an analyst in a CryptoQuant post, some BTC long-term holders seem to have taken profits in the past day. The relevant indicator here is the “Spent Output Profit Ratio,” which tells us whether Bitcoin investors as a whole are selling their coins at a profit or at a loss right now.
When this metric has a value greater than 1, it means the average holder has been moving their coins at some profit recently. On the other hand, values below the threshold suggest the overall market has been realizing some loss. Naturally, SOPR exactly equal to 1 implies that the investors are just breaking-even with their selling.
The “long-term holder” (LTH) group is a Bitcoin cohort that includes all investors who have been holding onto their coins since at least 155 days ago, without having moved or sold them from a single address. Here is a chart that shows the trend in the Bitcoin SOPR specifically for these LTHs during the last 15 days:
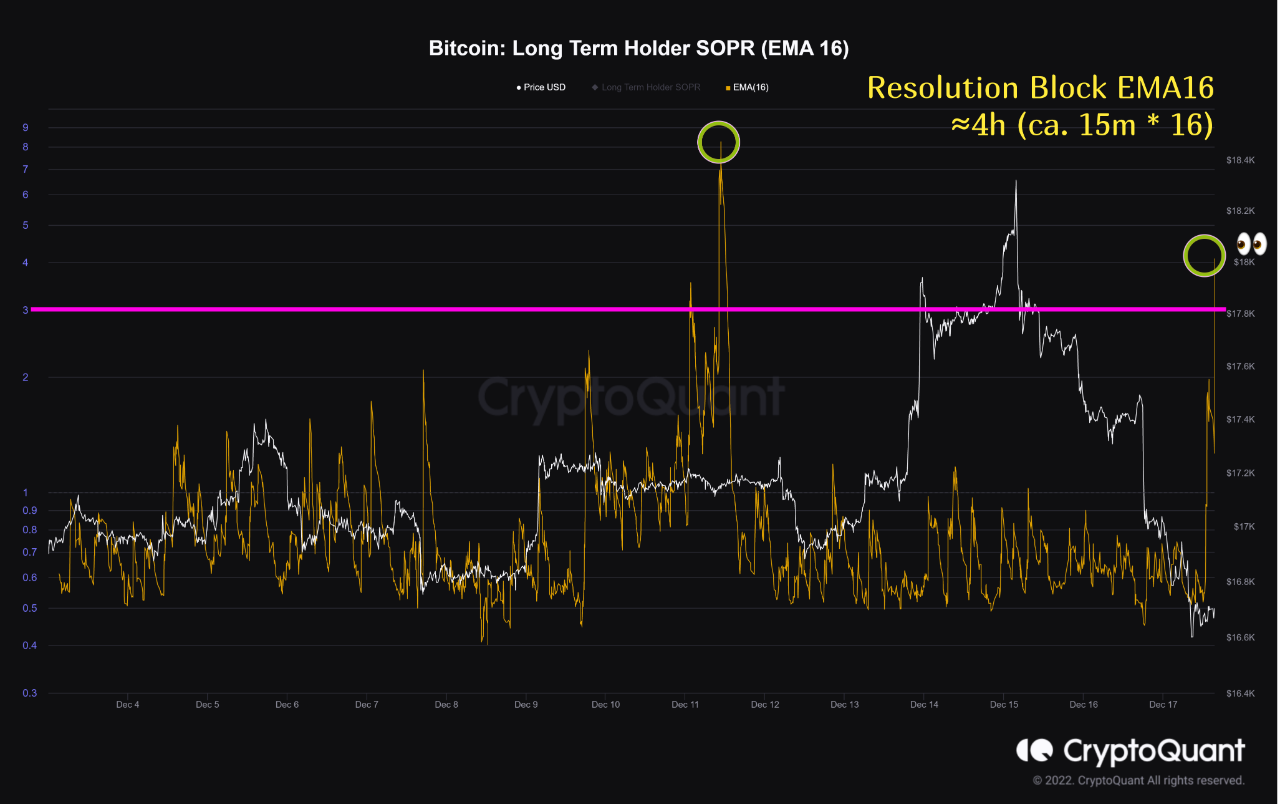
Looks like the EMA16 value of the metric has shot up in the last few hours | Source: CryptoQuant
As the above graph shows, the Bitcoin LTH SOPR (EMA16) has observed a sharp spike above 1 during the past day. This means that these holders have harvested some profits today. Statistically, LTHs are the investors least likely to sell at any point, so any dumping from them can have noticeable consequences on the BTC market.
From the chart, it’s apparent that when the indicator last saw such a large spike in its value, the price of the crypto had plunged down shortly after. Interestingly, the latest spike has only come after BTC has plunged down under $17k. Usually, such holders sell for profits during rallies, but here the dumping has come after the bullish momentum has already passed over.
This could be a sign that with all the FUD going around in the market right now, these supposed diamond hands have also broken down and feel bearish about the prospects of Bitcoin at the moment. Such a trend is likely to be negative for the price, and might take the crypto even further lower.
BTC Price

The price of the coin seems to have slid down over the last few days | Source: BTCUSD on TradingView
At the time of writing, Bitcoin’s price floats around $16.7k, down 2% in the last week. The above chart displays the trend in the value of the crypto over the last five days.
[ad_2]
Source link